Most bioprocess data is still collected by a person standing at a bench. Someone draws the sample, someone runs the analysis, someone decides whether to adjust the feed. That works between nine and five. It works less well at 2am on day four of a seven-day fermentation, which is often when the interesting things happen.
Automation in bioprocessing is usually framed as a scheduling problem — how to take a sample without a human present. In practice the harder question is what the system does with the result once it has it. A platform that samples automatically but still waits for a scientist to interpret the number has moved the bottleneck rather than removed it.
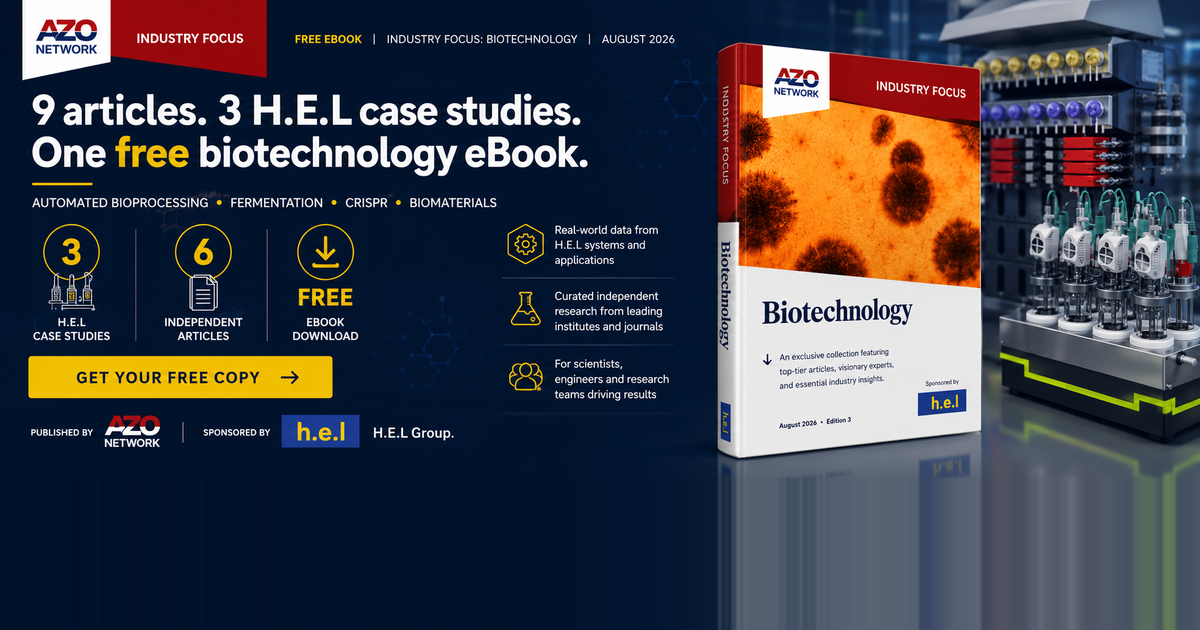
This article looks at what closing that loop actually requires, drawing on three case studies we contributed to AZoNetwork’s Industry Focus: Biotechnology eBook. The full collection is free and ungated at the end of this page.
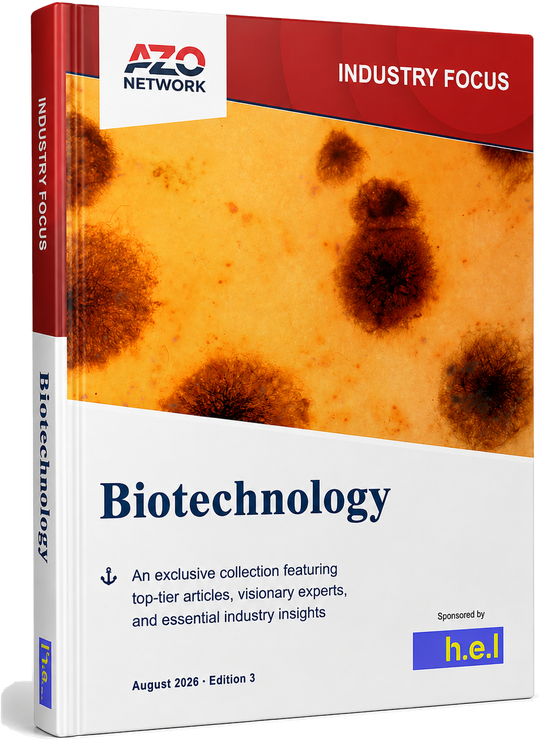
All three case studies below are in the free eBook. Nine articles, 48 pages, no form to fill in — download the PDF.
Three things people mean by “automated”
There are three distinct capabilities behind the word, and they are not equally difficult.
Automated control — holding temperature, pH, dissolved oxygen and stirrer speed at setpoint. Every modern bioreactor does this and has for decades.
Automated sampling and analysis — drawing material from the vessel and getting a measurement without anyone present. This needs liquid handling, sample transport, and analytical instruments that will accept a sample from a robot rather than a person.
Automated decision-making — using that measurement to change what the reactor does next. This is the step that turns a lab which runs overnight into one that runs unattended for a week, and it is where model-based automation earns its keep.
Most facilities have the first. Many have the second. The third is where the difference shows up in how much usable data you get per unit of calendar time.
Inside KIWI-biolab: the reactor as the operational core
The Chair of Bioprocess Engineering at Technical University of Berlin built the KIWI-biolab around exactly this problem. Its research focus is the model-based automation of bioprocesses and analytics — linking hardware to automation so the platform, rather than the operator, drives the experiment forward.
At the center of its BioXplorer Facility sits the BioXplorer 100, running continuous fermentations for up to seven days and fed-batch runs of up to 50 hours. The strains are predominantly Pichia pastoris and Escherichia coli, across projects spanning vaccine antigens, antibody production, and enzyme synthesis including glucose oxidase.
Three details from that setup are worth drawing out, because each is the sort of thing that decides whether an integration survives contact with a real lab.
Feeding is where automated fermentation gets hard. Fed-batch strategies at KIWI-biolab demand stringent control of liquid additions, and the platform’s liquid-feed module handles both continuous and pulse-based plans across acid and base for pH control, glucose or glycerol-based media, and methanol. Sampling automatically is of little use if you cannot also feed precisely — a week-long dynamic experiment needs both halves.
Temperature cycling is routine, and it goes below ambient. Many of these processes shift between roughly 20 and 37 °C. Holding a setpoint below room temperature requires active cooling, handled here through compatibility with a Huber Minichiller. Off-gas analysis runs in parallel through BlueSens sensors.
Integration was into existing infrastructure, not around it. The reactor was brought into the lab’s established setup rather than the facility being rebuilt around it. For most groups this is the deciding constraint. The question is rarely whether a platform is capable in isolation — it is whether it will cooperate with the liquid handler, the chiller and the analytics already on the bench.
The analytical half of the loop
Automated fermentation without automated analysis produces a reactor that runs itself and a queue of samples that doesn’t.
At KIWI-biolab, a Tecan Freedom Evo 150 liquid-handling station performs automated sampling, and also delivers supplementary pulses into the vessel — IPTG to induce gene expression in engineered strains, or magnesium supplements to the culture. MiLA, a mobile robotic lab assistant, then transfers those samples to the analytical platforms.
From there, a Cedex Bio HT measures process-relevant parameters — glucose, glycerol, acetate, magnesium and ammonia — while a two-dimensional HPLC QTOF resolves other substrates and metabolites in the culture medium.
The point of that chain is not the individual instruments. It is that the measurement arrives while the fermentation is still running, at a resolution manual sampling cannot match, which shifts process optimization onto data interpretation rather than the logistics of getting data at all.
Holding a culture still: the turbidostat
A batch culture gives you one growth curve per run and moves continuously through changing nutrient availability and metabolic state. If you want to study cells at a growth rate rather than passing through one, that is an expensive way to work.
A turbidostat holds cell density constant by reacting to turbidity feedback in real time and adjusting the inflow of fresh medium. The culture is maintained in a defined physiological state instead of travelling through a series of them.
On the BioXplorer 100 this runs through an integrated BioVIS probe for in-situ optical attenuation, with the pumping system controlled by WinISO. One practical wrinkle is worth knowing: at high biomass, optical scattering makes probe response non-linear, so a non-linear calibration curve is needed to relate probe output to actual cell density. Skip that and the control loop holds the wrong thing.
A representative E. coli run looks like this:
- Lag and early growth (0–155 min). A lag phase of around 55 minutes after inoculation, then OD climbs as DO falls with oxygen consumption.
- Exponential phase (155–300 min). Biomass rises rapidly, DO continues to fall. At about 275 minutes DO spikes sharply — the signature of media exhaustion.
- Turbidostat control engages (~300 min). On reaching the OD setpoint, the system enters dilution: feed pump flow increases, fresh medium enters, OD stabilizes at target.
- Steady state. Dilution brings cell concentration back to setpoint, DO spikes and settles, and the culture holds there for as long as you want to run it.
The result is consistent physiology across long or comparative experiments, parallel cultivation for screening, and no external optical monitoring hardware to integrate.
When oxygen is the ceiling — and why kLa isn’t the fix
In aerobic fermentation, the practical limit on density is often oxygen rather than nutrients. Oxygen is poorly soluble in aqueous media, and transfer rate becomes the cap on what the process can do.
The conventional response is more agitation or more gas flow. Both have limits — shear damage in the first case, foaming and stripping in the second. Shear is not a marginal concern for fragile organisms such as algae and amoeba, where it goes directly to cell integrity.
Pressure is a third route, and the reason it works is worth being precise about, because it is easy to state incorrectly.
Testing on the BioXplorer 400P — a four-zone parallel pressure bioreactor — used a 500 mL stainless steel reactor with a 300 mL working volume of dilute sodium sulfite solution, gassed at 1 vvm (300 sccm). Dissolved oxygen setpoints were held between 120 and 250 % with a back-pressure regulator working between 0.4 and 2.5 bar, and stability was then stress-tested by dosing sodium sulfite to scavenge oxygen out of the liquid — to which the regulator responded by raising pressure to hold the setpoint.
The instructive result is what didn’t change. Across the fitted regions, kLa came out at 2.0 min⁻¹ ± 10 %, independent of pressure. Pressure did not improve the mass transfer coefficient at all.
What it changed was dissolved oxygen concentration, which scales approximately linearly with oxygen partial pressure, in agreement with Henry’s Law. Pressure raises the driving force rather than the transfer coefficient — and because the two are separable, you can increase oxygen availability without touching agitation, and therefore without adding shear.
For groups whose aerobic process has plateaued and who have assumed the limit is biological, it is worth establishing whether the ceiling is in fact physical, and which of the two terms is actually binding. Earlier work has also shown constant kLa on these bench-top systems to be a workable basis for scale-up, with values reproducing in traditional-scale bioreactors.¹
What else is in the collection
Three of the nine articles are ours. The other six are independent research selected by AZoNetwork’s editors, and they range well beyond fermentation:
- A CRISPR tool that selectively cuts tumor DNA while sparing healthy cells
- Emerging nanoplatforms in biopharma — LNPs, exosomes and smart nanocarriers
- Sensor technologies in personalized biopharma
- An eco-friendly laser made entirely from biomaterials
- Bifunctional biomaterials for postoperative management of osteosarcoma
- CRISPR gene-drive technology that reverses antibiotic resistance in bacteria
We sponsored the edition; we did not commission or write those six. That is the reason it is worth the reading time — an editorial round-up that includes our work, rather than a brochure with articles arranged around it.
Download the collection
Industry Focus: Biotechnology — free eBook
Nine articles on automated bioprocessing, CRISPR, nanoplatforms and biomaterials. Three are our case studies; the other six are independent research selected by AZoNetwork’s editors.
No form. No email address required.
If you would rather talk through applying any of this to your own process, our bioprocess specialists are glad to have that conversation.
Frequently asked questions
What is a turbidostat, and how does it differ from a chemostat?
Both are continuous culture methods. A chemostat holds the dilution rate constant and lets cell density settle where it will. A turbidostat holds cell density constant by varying the dilution rate in response to turbidity feedback. A turbidostat is the better choice when you need cells held in a fixed physiological state, particularly at high density.
Does raising pressure increase kLa?
No — and this is a common misconception. In testing on the BioXplorer 400P, kLa held at 2.0 min⁻¹ ± 10 % and was independent of pressure. What pressure raises is dissolved oxygen concentration, which scales approximately linearly with oxygen partial pressure in line with Henry’s Law. Pressure increases the driving force for transfer, not the transfer coefficient.
Why use pressure instead of higher agitation?
Agitation raises oxygen transfer but adds shear, which damages fragile cultures such as algae and amoeba. Pressure raises dissolved oxygen without that penalty, so it suits shear-sensitive organisms and any process already at its agitation limit.
What is kLa?
The volumetric oxygen mass transfer coefficient — a measure of how efficiently oxygen moves from gas bubbles into the liquid. It characterizes how quickly oxygen becomes available to cells and is a standard parameter for aerobic fermentation performance and scale-up.
Can a bioreactor integrate with liquid handlers and robots we already own?
Yes, and it is usually the more important question than reactor specification alone. At KIWI-biolab the BioXplorer 100 was integrated into existing infrastructure alongside a Tecan Freedom Evo 150 liquid handler, a mobile robotic assistant, a Huber Minichiller and BlueSens off-gas analysis.
Is the eBook gated?
No. It downloads directly, with no form.
References
- Gill, N.K. et al. (2008) — constant kLa as a basis for scale-up from bench-top to traditional-scale bioreactors. (Cited in the source whitepaper; full citation to be confirmed before publication.)
- AZoNetwork (2026) Industry Focus: Biotechnology, Edition 3, August 2026. Sponsored by H.E.L Group.
- KIWI-biolab, Chair of Bioprocess Engineering, Technische Universität Berlin.