A Case Study describing the use of an iso-BTC to characterize a gel battery
Joseph Willmot, Dr. Mark Appleton
H.E.L Ltd, 9-10 Capital Business Park, Borehamwood, WD6 1GW
An iso-BTC is an isothermal calorimeter specifically designed for the testing of cells or battery packs. One of these units was coupled with a charge/discharge unit to help characterize “Battery A” over a wide range of operational conditions. From this, it was possible to observe certain characteristics and gain further understanding of the battery’s features.
Introduction
The iso-BTC provides thermal duty information in real-time, without any need for online calibrations or offline calculations. Operation from -40 oC to 100 oC is possible with pouch, prismatic or cylindrical batteries.
iso-BTC’s are normally paired with a charge/discharge unit to measure the electrical capacity of the cells and help characterize the nature of the cell. An iso-BTC can measure the amount of energy and power generated during the charging and discharging of the cells, while keeping the cell at a constant temperature. Thus, the iso-BTC is performing the battery temperature management task, and the results can be directly applied to real-world examples.
“Battery A” was tested due to its wide availability, durability, and similar design features with other gel batteries. Battery A has a charge capacity of 2.2 Ah, and is comprised of three gel cells that are connected in series, in a common housing with passive charge balancing.
This study aims to highlight how an iso-BTC can help characterize features of Battery A that could be related to the batteries cell’s design, composition, or State Of Health (SOH).
Equipment and Methodology
The iso-BTC operates by balancing heating and cooling duties to maintain a battery isothermally. The cooling is applied to the battery via two thermally conducting plates, that has a temperature below that of the battery set point. A heater is then secured to the battery, and off-sets the cooling duty to obtain the set battery temperature. This is known as Power Compensation.
Once the battery is at a stable temperature, the power from the heater will also be stable. Any exothermic or endothermic event that is generated from the battery can be quickly compensated for via increasing or decreasing the power from the heater. The difference in power from the baseline can therefore be measured as the power of the exothermic and endothermic event.
Temperature dependence of charge/discharge cycling of Battery A
Battery A was charged (at 5 Amps) and discharged (at 8 Amps) at temperatures between 60 oC and 0 oC – the resulting battery temperature and heater power profiles are shown in Figure 1 below.
Analysis of the controller output yields the following heat and energy release profiles, as shown in Figure 2.
 |
|
| Figure 1 – 60oC to 0oC – 5A Charge/8A Discharge | Figure 2 – Heat released During 5A Charge/8A discharge |
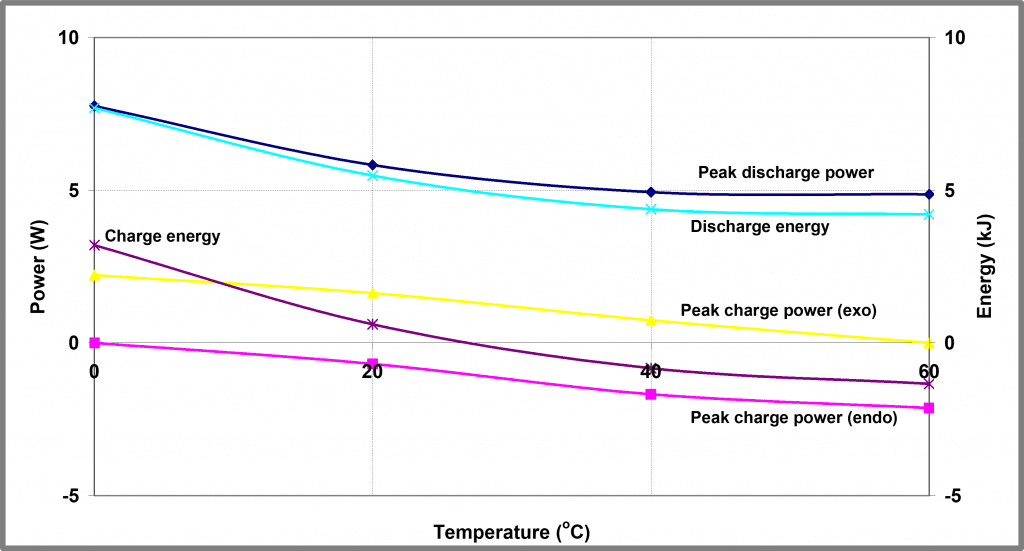
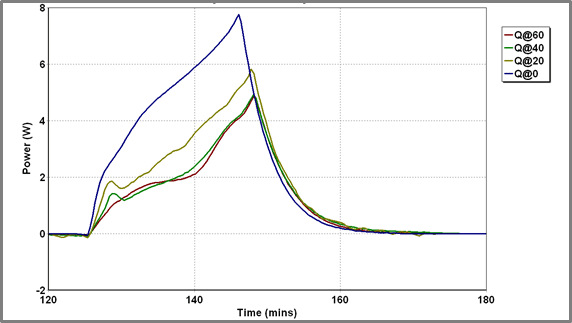
Both charge and discharge profiles show interesting changes in shape as the temperature is reduced, although this is most marked in the case of the charging process which is entirely endothermic at 60 oC but entirely exothermic at 0oC. At intermediate temperatures reproducible, transitional behavior is observed. The peak power and energy outputs as a function of temperature during battery charge/ discharge cycling is shown in Figure 3 below. The charging power profiles at the 4 temperatures are overlaid in Figure 4 below.
NOTE: since battery charging is both endothermic and exothermic two separate charging power profiles are shown.
 |
|
| Figure 3 – Temperature dependence of Battery A | Figure 4 – Charge Profiles for Battery A at different temperatures – power release |
As well as the transition from endothermic to exothermic behavior, there are other changes evident in this data; a small exothermic peak in the heat output (occurring after about 80 mins in Figure 4 above) is visible even at 60 oC but grows in magnitude as the temperature is reduced. This peak likely corresponds to some solid-state transformation within the battery and is visible in both charge and discharge profiles at virtually all charge/ discharge rates.
The exact shape of the discharge profiles is also strongly dependent on temperature. As the temperature is reduced the discharge becomes increasingly exothermic. Additionally, the sharp pre-peak referred to above is generally visible soon after the onset of the discharge profile although how visible this is does depend on the charging history of the battery. The discharge profiles at various temperatures are superimposed in Figure 5.
Battery A’s capacity is seemingly dependent on temperature. The charge and discharge current profiles are shown in Figure.6
 |
|
| Figure 5 – Discharge Profiles for Battery A at different temperatures – power release | Figure 6 – Battery current and battery heat released during charge/discharge cycling Battery A at a range of temperatures |
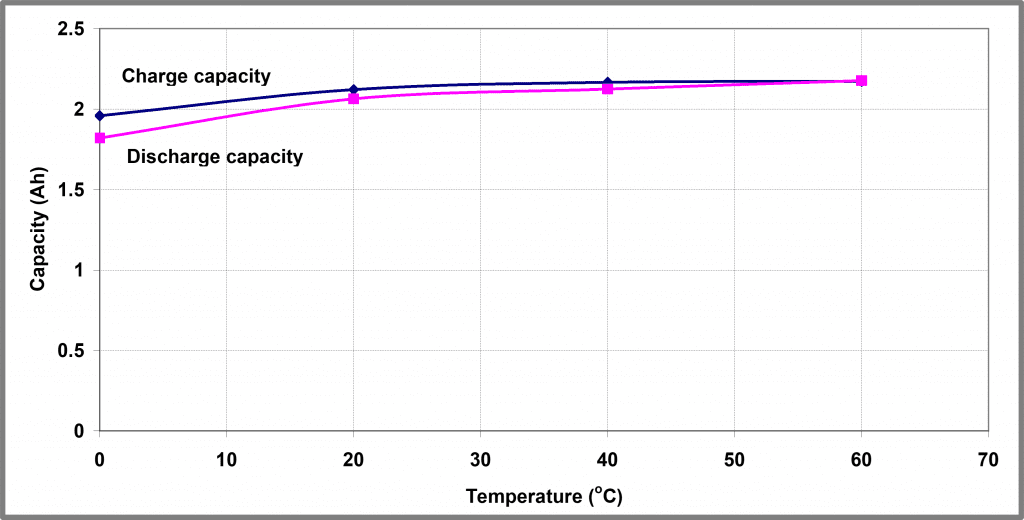
Integrating these profiles gives a measure of the amount of charge that can be removed from the battery as a function of temperature – these profiles are shown graphically in Figure 7.
A ratio of the charge/discharge capacity, known as the efficiency of the battery, is shown in Figure 8. It shows that both the capacity and efficiency are heavily influenced by the battery’s temperature.
 |
|
| Figure 7 – Temperature dependence of 5 A charge/8 A discharge cycling of Battery A | Figure 8 – Temperature dependence of 5 A charge/8 A discharge capacity ratio of Battery A |
Additional complications exist with Battery A due to its design of 3 separate cells which are connected in series with no control over the charging and discharging of the individual cells. While cells are generally selected to be tolerably well-matched when the battery is first assembled, as the cells age, they do not necessarily do so evenly and imbalance can/ will develop within the battery during normal use. This is unless some form of active or passive charge balancing is implemented1.
Instead, a conservative charge and discharge strategy should be employed in which individual cell voltages are monitored, and charging and discharging is terminated as soon as any cell in the stack reaches the appropriate unsafe threshold. The impact of this is that the useful capacity of the battery is typically somewhat lower than the nominal capacity and prone to decrease. As this process continues the depth of charge/ discharge of some cells will decrease resulting in subtle changes in calorimetry profiles. If this conservative approach was not adopted (i.e. before individual cell voltages were monitored), it is highly like that some batteries could have been destroyed by overcharging and over-discharging with the associated safety implications.
1 With active charge balancing a cell with a “high” voltage (i.e. higher than the stack average) will be used to charge a cell with a “low” voltage. In the case of passive cell balancing cells with high voltages are discharged through a balancing load until their voltages match those of the lower voltage cells in the stack.
Fine details on Battery A’s charge and discharge profiles
Due to the extensive study of Battery A on an iso-BTC, there are many examples of calorimetry profiles for this battery at many different temperatures and charge/ discharge rates. All these profiles have shown grossly similar features, independently of cooling method or heater/ thermocouple positioning.
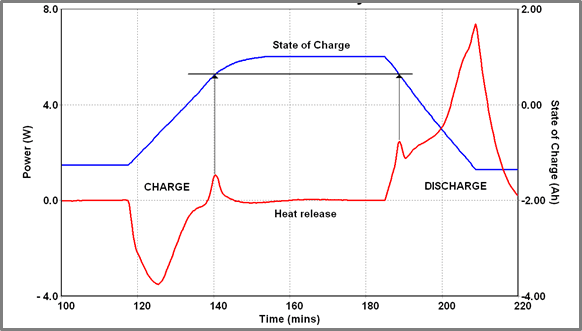
On top of these gross features are several much smaller, but reproducible, features which likely correspond to some underlying changes that are occurring within the batteries themselves. One such group of features is shown in Figure 9 below (and were introduced in the preceding sections of this note).
This figure shows a charge/ discharge cycle for a Battery A run at 40 oC. At this temperature, the charge cycle is largely endothermic although a short-lived exothermic event does occur close to the end of the charge cycle. A similar, equally short-lived exothermic event occurs soon after the start of the discharge cycle. On examining the State of Charge (SOC) profile throughout this cycling procedure it becomes clear that these two events occur at identical SOC values (0.61 Ah below max charge). It is perhaps more interesting that when the charging current is reduced and the charging cycle consequently lengthened exothermic events are seen in every cycle at the same SOC.
In Figure 10, the battery is repeatedly charged and discharged – charging current is varied stepwise from 5 A down to 0.5 A – the discharge rate is fixed at 6 A (using a fixed load). Determining the SOC of the battery when the “spike” occurs the following data is obtained.
 |
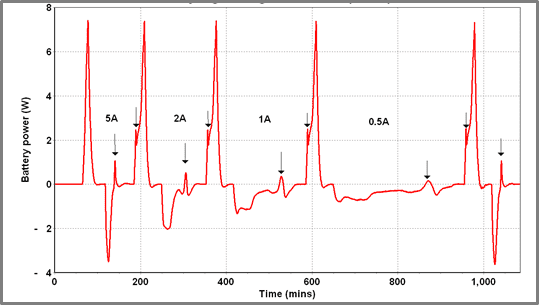 |
| Figure 9 – Exothermic spike on charge and discharge cycles of Battery A | Figure 10 – Charge/discharge cycling of Battery A at varying charge currents (40 oC) |
Table 1 – Spike position dependent on charge/discharge rate
| Cycle | Cycle Spike position (mAh below full charge) |
| 6 A discharge | – |
| 5 A charge | 610 |
| 6 A discharge | 610 |
| 2 A charge | 610 |
| 6 A discharge | 610 |
| 1 A charge | 610 |
| 6 A discharge | 610 |
| 0.5 A charge | 600 |
| 6 A discharge | 600 |
The following observations can be made
- The SOC when the spike occurs is highly reproducible
- The “spike” is missing from the first discharge cycle – this could be a consequence of the lower initial charge on the battery (caused by self-discharge) or because some aging phenomenon can occur in a charged battery after which the exothermic process does not occur.
This clearly shows how calorimetry can be used to provide information beyond the simple heating and cooling duty of a battery pack and it is difficult to see what other tools could be used to provide similar information for such a microscopic, highly energized structure.
Impedance analysis of Battery A discharge profiles
Beyond the identification of the sharp exothermic feature described above (that has been attributed to some rearrangement within the battery electrodes), it was felt that some further analysis of the battery discharge profiles might be possible. The profiles all had a similar shape – see Figure 11 below.
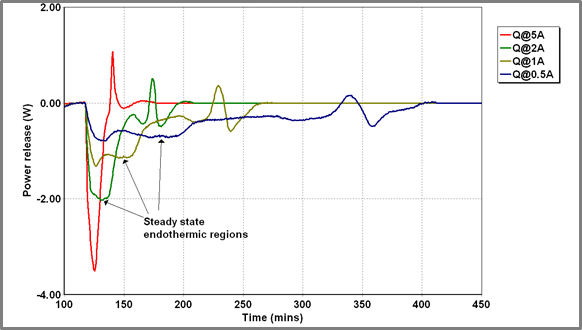
Figure 11 – Power release from Battery A at various charging currents
Initially, there is a relatively constant endothermic output which later diminishes and is followed by the exothermic spike which has already been discussed. The thermal output from the battery will include a thermodynamic term associated with the battery chemistry and an ohmic heating term associated with substantial current flow through the battery resistance. Where the battery is initially uncharged (minimizing “second-order” interaction effects) we might assume the thermodynamic term to be linear in current:
Q= kI – I2R
I is the battery current
Q the output (+ve indicating endotherm)
R is the effect of battery resistance
K is an unknown constant to be determined
If we fit an expression of this form to the initial steady-state heat output from the experiment above with two repeated tests, we yield the three profiles shown below in Figure 12. Yielding the following values for the model parameters
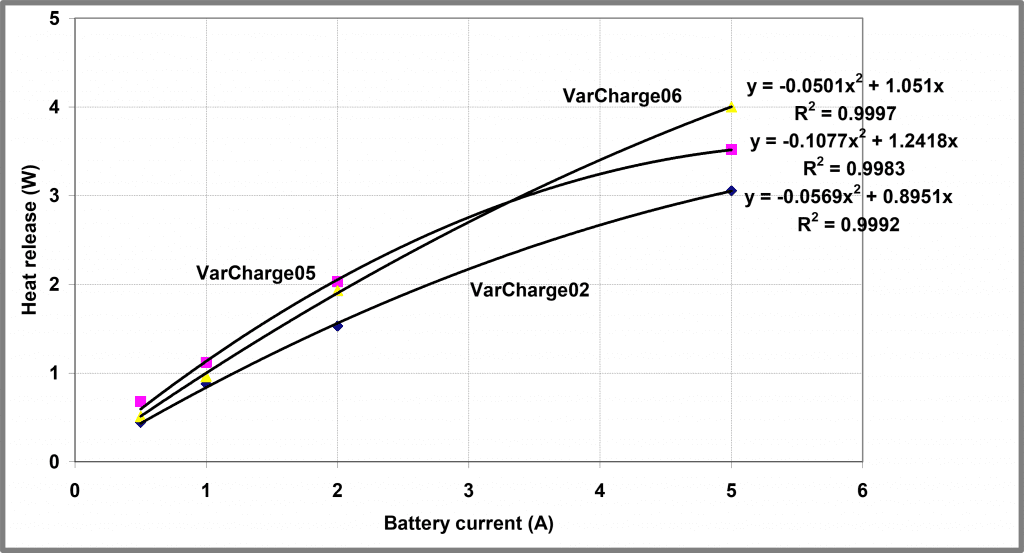
Figure 12 – Modelling steady-state heat released from Battery A
Table 2 – Resistance and Constants of battery dependent on battery SOH
| Experiment | R | K |
| VarCharge02 | 0.0569 | 0.895 |
| VarCharge05 | 0.1077 | 1.242 |
| VarCharge06 | 0.0501 | 1.051 |
The correlation coefficients obtained in this analysis are tolerably good but are not all that compelling. Better reproducibility in K between experiments can help reflect the underlying chemistry. However, these three experimental repeats utilized batteries in different States of Health (SOH), thus perhaps this degree of variability might be expected.
Conclusion
This case study has successfully demonstrated how an iso-BTC helps identify battery and cell characteristics, that allow for greater understanding of the chemical, electrical and thermodynamic properties of the tested battery.
Whist the iso-BTC does not provide details of exact internal cell structure, it does help characterize what the net effects of changing the cell composition are. Important parameters for the battery temperature management system can easily and readily be defined by the results from an iso-BTC


